This time I continue to set up a toolchain for the RP2040 for Ubuntu Linux 20.04 running as a virtual machine. To follow along, you'll first need to set up the basics--or at least skim the last post--here.
Hello again! There are about 8 billion people in the world; am I the only one who wants to set up a debugger for the RP2040 MCU--what the Raspberry Pi Foundation calls "PicoProbe"--centered around an Ubuntu 20.04 LTS virtual machine?
And code in C, not MicroPython?
Um....Perhaps?
Picture this: a debugger interface as big as a box of matches. Works from Linux command line as well as VSCODE. We can put the incredible horsepower of GDB--a well known open source C/C++ debugger--to debug an ARM MCU....the RP2040....all for $4USD?....unbelievable!!!!
If I can get it to work.
WTPP (or) Rasberry Pi in yo Face
PicoProbe uses an intermediate Raspberry Pi PICO dev board to provide SWD debugging to our target RP2040; we also need a computer to run GDB.
It's not simple.
I found generic Linux debugger toolchain installation steps from Raspberry Pi and elsewhere, but quickly discovered they didn't apply and/or were out of date for Ubuntu Linux 20.04. And, almost every Linux based build I found used a Raspberry Pi SBC as the host Debian based PC, e.g., here, as opposed to an Ubuntu virtual machine.
Sure I could set the step debugger up on a Raspberry Pi SBC, but they are very hard to buy right now, being out of stock everywhere. And to paraphrase the great John F. Kennedy: we do [Embedded C toolchain setups on Ubuntu] not because they are easy, but because they are hard.
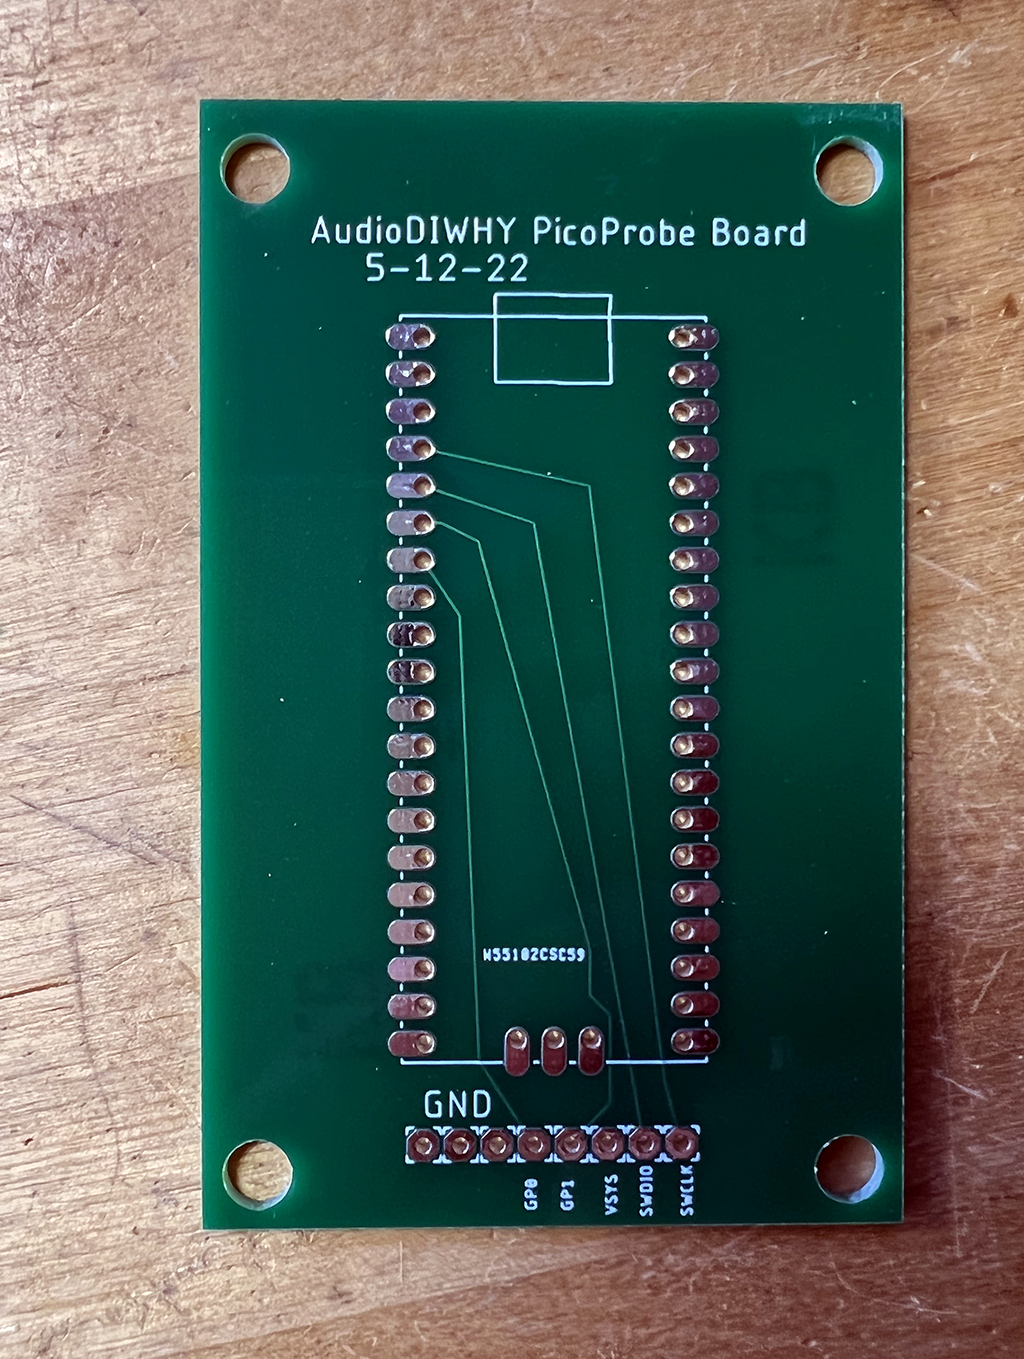
 |
| I created a simple PCB to simplify patching between a PicoProbe SWD Debugger (left) and the RP2040 Pico target (right). I'll go over this PCB in this post. |
Let's go!!
I found two thorough videos for setting up a PicoProbe toolchain on Windows: here and here, and a good document outlining the same idea here.
To understand how the toolchain (PC > PICO running a "PicoProbe UF2 > target RP2040) works, please watch the beginning (at least) of the excellent video from Shawn Hymel, here. I am not going to outline each piece of the computer > Picoprobe > PICO debug toolchain puzzle in this post, because Shawn does an great job explaining them in his video.
Me? I followed the RPI PICO Getting Started Document, page 58, and installed these packages on the Ubuntu 20.04 VM:
#sudo apt install automake autoconf build-essential texinfo libtool libftdi-dev libusb-1.0-0-dev
Next I followed the instructions on page 57 of Getting Started to set up a special pico version of OpenOCD, the service that allows the GDB debugger to talk to the Pico.
#git clone https://github.com/raspberrypi/openocd.git --branch picoprobe --depth=1 --no-single-branch
#cd openocd
#./bootstrap
#./configure --enable-picoprobe
#make -j4
Here I found my first serious bump. OpenOCD wouldn't compile--error 2 during the make command. The error was an indent bug (?) deep in the guts of the downloaded openocd.git code.
No way I had time to rewrite the customized openocd source code so it'd compile on Ubuntu, that would have taken forever. Crap!
After digging into the branches of the github repo, I guessed that the git clone command provided by RPi was out of date; I figured the repo changed and the official documentation didn't keep up.
With fingers crossed I issued this command:
#make clean
then this:
git clone https://github.com/raspberrypi/openocd.git
cd openocd
./bootstrap
./configure --enable-picoprobe
make -j4
sudo make install
Ha! It compiled! I was right I think; the repo had been updated, but not the documentation. Time wasted: maybe 45 minutes.
Next I created a UF2 file for the Picoprobe. This was straightforward, I used the toolchain I set up in last time and ran this:
(cd to your projects folder)
#git clone https://github.com/raspberrypi/picoprobe.git
#mkdir build
#cd build
#cmake ..
#make
No issues here.
I uploaded the PicoProbe UF2 file to the Raspberry Pi Pico dev board I was going to use as the "go between". You can see how to do that here:
"hold down the BOOTSEL button while plugging the board into USB. The uf2 file below should then be copied to the USB mass storage device that appears."
PICOPROBE PCB
I could have wired up this second PICO running the PicoProbe UF2 on another breadboard, but instead I got help from my faithful sponsors, designed a super simple PCB, and uploaded it to PCBWAY for quick fabrication.
Back it came:
 |
| Boards arrived super fast from my generous sponsors PCBWAY. Please help out a blogger (me) who is trying to teach himself electrical engineering in his spare time and check 'em out. |


 |
| bottom view.... |
Next I wired the new Pico Probe PCB (left) to the blink board from last time using dupont type M/M cables:
 |
| (The board on the right is running the Boring Blink Sketch from last time.....) |

 |
| For wiring I matched the females on the probe board (left) to a Pico dev board (right). The PCB has the names of the pins to connect to the target--so, wire SWCLK legend on the PicoProbe PCB to the SWCLK Pin on the target breadboard, the GP0 pin on the PicoProbe PCB to GP0 on the target, and so on. |
The LED on the PICO board went solid--and the target BLINKCL PICO still binked--still alive! The PCB worked. I put the PicoProbe PCB on PCBWAY's projects page; if you want to get one, go here.
Next I needed to get OpenOCD configured. In this use case, OpenOCD allows the computer to "talk to" GDB.
But did openOCD start up? Not at first. I started up a new terminal on my Ubuntu system, but the bash code on page 60 of getting started didn't start openOCD on Ubuntu correctly and kept throwing errors.
Fiddlesticks!!!!
After messing around with different command line variations, I eventually go this to work:
#sudo ./openocd -s ../tcl -f ../tcl/interface/picoprobe.cfg -f target/rp2040.cfg
And could see this from the Ubuntu terminal:
Open On-Chip Debugger 0.11.0-g610f137d2 (2022-05-28-16:27)
Licensed under GNU GPL v2
For bug reports, read
http://openocd.org/doc/doxygen/bugs.html
Info : only one transport option; autoselect 'swd'
adapter speed: 5000 kHz
Info : Hardware thread awareness created
Info : Hardware thread awareness created
Info : RP2040 Flash Bank Command
Info : Listening on port 6666 for tcl connections
Info : Listening on port 4444 for telnet connections
Info : clock speed 5000 kHz
Info : SWD DPIDR 0x0bc12477
Info : SWD DLPIDR 0x00000001
Info : SWD DPIDR 0x0bc12477
Info : SWD DLPIDR 0x10000001
Info : rp2040.core0: hardware has 4 breakpoints, 2 watchpoints
Info : rp2040.core1: hardware has 4 breakpoints, 2 watchpoints
Info : starting gdb server for rp2040.core0 on 3333
Info : Listening on port 3333 for gdb connections
arm-none-eabi-gcc --version
arm-none-eabi-g++ --version
arm-none-eabi-gdb --version
arm-none-eabi-size --version
Next I ran gdb (finally!) vs. the BLINKCL elf file from last time:
#arm-none-eabi-gdb BLINKCL.elf
and got this at stdout:
target remote localhost:3333
(gdb)
OMG! The beloved (gdb) prompt! Was this going to work????
(gdb) load
rp2040 running BLINKCL stopped blinking
(gdb) monitor reset init
(gdb) continue
the rp2040 started blinking!!!
and we see the (gdp) prompt again!
It worked!!!! I could now use command line gdb to debug, same as if I was debugging C code on Linux!!!
BONG HIT VICTORY!
But wait--we're not done!
Could I get debugging to work without leaving VSCODE? The video here and accompanying webpage here made this look--doable.
I followed this Shawn Hymel webpage and followed the section on installing the Cortex Debug plugin on. It all seemed to be OK, including coding the settings.json and launch.json scripts.
However, when i tried to use Cortex/VSCODE to debug the blink elf file I got this:

Great, there was some sort of log to review, but where was this gdb-server's output?
I wasted at least two hours throwing every bit of GDB kung fu I knew at this....do we enable logging? Does log.txt show up somewhere?
It should right? However, there was frighteningly little information I could find online. Again, there are 8 billion of us, but I may very well be the only person trying to set up this exact version of the toolchain. Damn.
After many frustrating hours on this, I decided to watch videos about STM32 VSCODE toolchains, since I remembered that some of them used the same VSCODE Cortex Debug plug in. There was zilch about RP2040 and this error, but maybe it occurs for other MCUs?
Bingo! That did the trick, STM32's VSCODE toolchains indeed can throw the same error, and I saw a video that revealed the output for GDB was in VSCODE's terminal--click on the TERMINAL tab then on the right, the gdb-server link--my lord, how did I miss this???

From here--now that I could read the logs--it was obvious that it was a Linux rights issue for the USB port for the PicoProbe.
I had seen this issue before; to fix it I ran this from the Ubuntu VM:
#sudo lsusb
Which showed me:
Bus 002 Device 005: ID 2e8a:0004 Raspberry Pi Picoprobe
I chmod'd that....
sudo chmod 666 /dev/bus/002/005
After, the VSCODE debugger worked! Time wasted--oh, never mind.


No comments:
Post a Comment