In the previous post here I set up a $4 "Picoprobe" to debug RP2040 C/C++ code running on a PICO development board.
This worked OK but I found it a bit unwieldy at times; the debugger was often physically larger than whatever I was debugging.
Could I get a smaller debugger into play?
A tech friend told me about the "EDU" version of popular Segger J-LINK debuggers; I read online that Segger had made a "mini" version of it.
 |
| Segger's J-LINK EDU MINI debugger. Yes, it's mini. |
I emailed them; their sales team got back to me quickly.
This is a USD $60 purchase for non-commercial use; even though it's for education ("EDU") you don't have to present a student ID.
But you also can't make money off your code.....all audioDiWHY code is MIT open source so I figured: I qualified.
The Segger page here made me think the adapter would work for debugging RP2040's. For what this debugger can do and all the Segger software it came with it seemed like a hell of a bargain.
I bought one.
WIRING IT UP
It's tiny! Its JTAG/SWD interface uses 2x5 pin 50 mil pin headers--1.27mm --extremely small--conforming to the "Coresight 10" JTAG pin specification.
The unit comes with a 10 pin to 10 pin IDC ribbon which won't work with the PICO; the PICO has SWD pins that are 100mils apart.
I had a JTAG 50 mil to dupont breakout I got with my Atmel Ice programmer; this breakout was unused, so I used it here; you will need something similar; try the link here.
OK, time to wire it up. I had to dig around on the Internet re: how to connect the EDU mini to a Pico Dev board and eventually figured it out:
 |
| An SWD breakout is coming soon from this blog's helpful sponsor: PCBWAY. |

Unexpected: "pro" Segger J-Links have a 5V output for powering your development board, but the EDU mini requires a 5V reference and cannot source 5V.
So: I used a bench 5V power supply for this.
It was time to check my wiring. On my windows system I installed the Segger tools (here) and ran their Commander utility to verify all the wiring was sound--it was.
DEBUG SOFTWARE
From the previous RP2040 debugger post I knew I needed a version of GDB for the Segger J-link, since GDB can be to be hardware dependent; fortunately Segger's build of GDB for the J-Link was available as a free download: here.
OK, the next problem: how to set up the modified debug toolchain without going crazy?
After some research: I would continue to use Ubuntu VSCODE (as opposed to a different IDE) as the path of least resistance.
Note:The previous post on the initial Ubuntu/VSCODE toolchain setup is here. If you are setting up Segger/GDB/VSCODE for RP2040 "from scratch" you may want to read it or find advice elsewhere on the Internet.....you will need the same extensions for VSCODE installed for the Segger debugger to work as PicoProbe: C/C++ and Marus25's Cortex Debug, along with the arm-non-eabi compiler and so on.
I installed Segger's GDB code on Linux (I use an Ubuntu virtual machine) which ended up in /opt/SEGGER.
Now came the tricky part: getting VSCODE's dreaded launch.json file configured use Seggar's version of GDB.
Here is the launch.json I ended up using; this got copied into my project folder's hidden .vscode subdirectory after renaming the existing picoprobe launch.json file to launch.json.old.
####################
{
"version": "0.2.0",
"showDevDebugOutput": "raw",
"configurations": [
{
"name": "J-Link",
"cwd": "${workspaceRoot}",
//"gdbPath": "gdb-multiarch",
"gdbPath" : "/usr/bin/arm-none-eabi-gdb",
"executable": "${command:cmake.launchTargetPath}",
"servertype": "jlink",
"serverpath": "/opt/SEGGER/JLink/JLinkGDBServer",
"armToolchainPath": "/usr/bin/",
"request": "launch",
"type": "cortex-debug",
"interface": "swd",
"serialNumber": "801056408", //yours won't be
"device": "RP2040_M0_0",
"svdFile": "${env:PICO_SDK_PATH}/src/rp2040/hardware_regs/rp2040.svd",
"postRestartCommands": [
"break main",
"continue"
]
}
]
}
In VSCODE, on the bottom right, I had to set the file type for launch.json from "commented JSON" to
"plain text"....then throw away the previous build file and recompile my stupid blink main.c then push the .UF2 file to the Pico.
It worked!
With this new debugger in play: I can see registry contents, set breakpoints, watch variables, all the usual debug stuff, without having to leave VSCODE.
And--I got it to work in about 4 hours, start to finish, on single Sunday--surprising even myself.
SIDENOTE: RTT ADD-IN--FAST PRINTF()
GDB is cool, but arguably nothing in the debug world is easier and cheatee-er than a C printf() statement to reveal a variable's value or whatever.
Come on, we all do it right?
Problem with printf(), the version in the RP2040 stdlib anyway: it's pretty MPU hungry and can jam up other I/O while sending strings to the terminal.
SEGGER provides a freely available, more efficient printf() algorithm that's easy to throw into your project.
Here's how I set that up:
- Downloaded the tools for debian from the "J-Link Software and Documentation Pack", here.
- Right clicked on the .deb file, said "use other software" and ran the .deb installer.
- The files I needed got installed in /opt/SEGGER.
- Gunzipped/unpacked the files in /opt/SEGGER/JLink_[version]/Samples/RTT;
- I needed SEGGER_RTT.c, SEGGER_RTT.h, SEGGER_RTT_Conf.h, and SEGGER_RTT_printf.c....
- I copied those files into my RP2040 project.
Next I modified CMakeLists.txt and .c files to get the RTT printf() statement to work.
Please go to Github (here) and look at the example/proof of concept files, including an example CMakeLists.txt; I think you will find it pretty easy to get an RTT printf() statements into your projects once you see the examples....in the repo--main() is in the file blinkcl.c....
If you want to download and run the Proof of Concept, I called the project BLINKRTT; to make life easy, grab the UF2 file from the repo and upload it to your Pico dev board.
With the sample code loaded into a Raspberry Pi Pico:
- I hooked up the J-Link Debugger using the wiring diagram above.
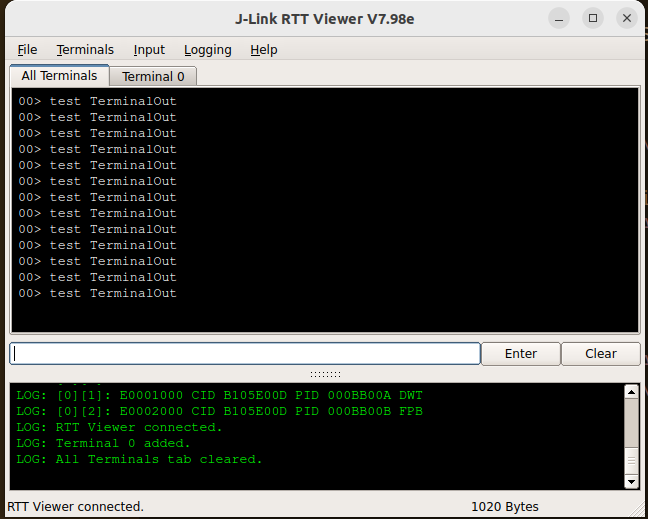
- Went back back to opt/SEGGER and opened JLinkRTTViewerExe:

With the RTT viewer open I needed to connect the RP2040, so I went to to file > connect and clicked the three dots (...)

and choose the RP2040 Core 0 from the drop down, finally, clicked OK.

When I powered up the PICO the RTT print statements showed up in the RTT viewer:
RTT has a bunch of other cool features--printf() is only a small part of what it can do--more information here.
OUTTRO
Overall this was a great addition to my bench tools. Getting the J-Link Mini going was much smoother sailing than other debug hardware + software setups to date.
For $60 the Segger J-Link EU MINI is a heck of a deal, especially considering all the software that comes with it.
In future posts I will build/post a simple JTAG to SWD breakout board, which will hopefully make quick setup for the JLINK and other SWD debuggers. (Update--ha! done, works! go here)
Until then: don't breathe the fumes.


No comments:
Post a Comment